1
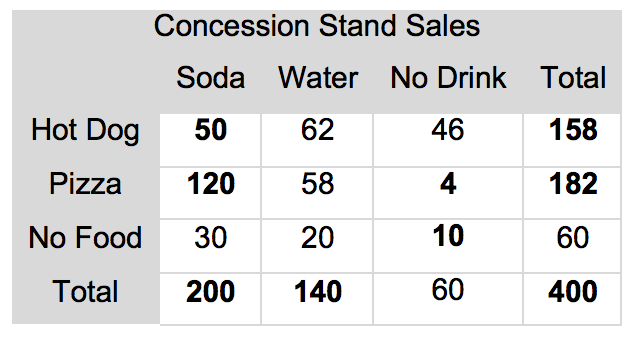
De quelle manière puis-je construire une table de fréquence bidirectionnelle dans Rmarkdown? Quelque chose comme:Tableau des fréquences bidirectionnelles dans Rmarkdown
J'ai essayé d'utiliser à la fois la fonction Kable du paquet knitr et la fonction datable du paquet DT, mais aucun ne m'a donné le résultat souhaité.
Mise à jour: Code reproductible avec exemple.
a <- sample(x = c(1,2,3), size = 1000, replace = T)
b <- sample(x = c('a', 'b', 'c'), size = 1000, replace = T)

df <- data.frame(vertical_title = a, horitzontal_title = b)

table(df)

       horitzontal_title
vertical_title a b c
      1 118 98 106
      2 106 95 121
      3 128 114 114
Je veux 'vertical_title' et 'horizontal_title' pour être visible pour ma table Rmarkdown.
Votre question est difficile à répondre comme ça. S'il vous plaît voir [ici] (https://stackoverflow.com/questions/5963269/how-to-make-a-great-r-reproducible-example) pour obtenir des conseils sur la façon de fournir un exemple reproductible. – Florian
Bon point Florian, j'étais un peu pressé. J'ai ajouté un exemple reproductible. – Michael